matplotlib的常用样例

matplotlib的常用样例

一般matplotlib我选择配合jupyter食用

1
2
3
import numpy as np
import matplotlib.pyplot as plt
%matplotlib inline
1
2
3
acc = [0.1, 0.4, 0.9, 0.3]
epochs = [0, 1, 2, 3]
loss = [1, 0.9, 0.7, 0.6]
1
2
3
4
5
6
7
8
9
10
11
12
13
14
15
16
17
18
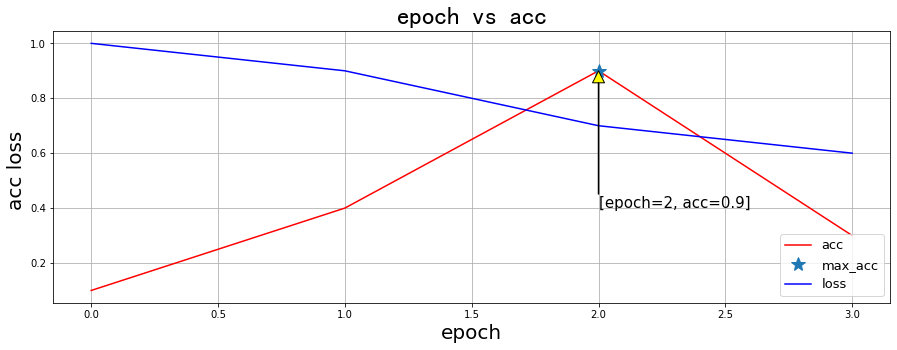
fig, ax = plt.subplots(1,1,figsize=(15, 5))
plt.subplots_adjust(left=None, bottom=None, right=None, top=None, wspace=None, hspace=None)

max_index = np.argmax(acc)
ax.plot(epochs, acc, 'r')
ax.plot(max_index, acc[max_index], '*', markersize=15)

show_text = '[epoch={}, acc={}]'.format(max_index, round(acc[max_index],7))
arrowproperty = dict(facecolor='yellow', width=0.5)
ax.annotate(show_text, fontsize=15, xy=(max_index, acc[max_index]), xytext=(max_index, acc[max_index]-0.5), arrowprops=arrowproperty)

ax.plot(epochs, loss, 'b')

ax.legend(['acc', 'max_acc', 'loss'], loc='lower right', prop={"size": 13})
ax.grid()
ax.set_xlabel('epoch', fontsize=20)
ax.set_ylabel('acc loss ', fontsize=20)
ax.set_title('epoch vs acc', fontproperties='SimHei', fontsize=25, color='black')

png


画子图的一种方法

1
2
3
4
5
6
7
8
9
10
11
12
13
14
15
16
17
18
19
20
21
22
23
24
plt.style.use('seaborn-ticks') # 风格
fig, axes = plt.subplots(2,2,figsize=(10, 10)) # 2行3列的子图布局,大小为10x10

# 子图之间的间隔
plt.subplots_adjust(left=None, bottom=None, right=None, top=None, wspace=None, hspace=None)

from PIL import Image
img_1 = Image.open(r'用户头像4.png').resize((200, 200))
img_2 = Image.open(r'用户头像5.png').resize((200, 200))
img_3 = Image.open(r'用户头像6.png').resize((200, 200))
img_4 = Image.open(r'用户头像7.png').resize((200, 200))

# 样例(图片的引用)
axes[0, 0].imshow(img_1)
axes[0, 0].set_title('玉子', fontproperties='SimHei', fontsize=20, color='lightgreen')

axes[0, 1].imshow(img_2)
axes[0, 1].set_title('薇尔莉特', fontproperties='SimHei', fontsize=20, color='lightgreen')

axes[1, 0].imshow(img_3)
axes[1, 0].set_title('牧野神奈', fontproperties='SimHei', fontsize=20, color='orange')

axes[1, 1].imshow(img_4)
axes[1, 1].set_title('还是玉子', fontproperties='SimHei', fontsize=20, color='orange')

png


画子图的另一种方法

1
2
3
4
5
6
7
8
9
10
11
12
13
14
15
16
17
18
19
20
21
22
plt.figure(figsize=(10, 10))
plt.subplots_adjust(left=None, bottom=None, right=None, top=None, wspace=None, hspace=None)

all_x = []
all_y = []

all_x.append([0, 1, 2, 6, 3, 5])
all_y.append([2, 5, 7, 9, 8, 1])

x = np.arange(0, 6, 0.1) # 等差数列,(0,6)范围每隔0.1取一个值
all_x.append(x)
all_y.append(np.sin(x))

all_x.append(x)
all_y.append(np.cos(x))

all_x.append(x)
all_y.append(x**3)

for i in range(4):
ax = plt.subplot(2, 2, i+1)
plt.scatter(all_x[i], all_y[i])

png


本博客所有文章除特别声明外,转载请注明出处!